Data Scout is Localogy’s series that curates and draws meaning from third-party data. Running semi-weekly, it adds an analytical layer to the industry data that we encounter in daily knowledge building. For Localogy original data, see the separate Modern Commerce Monitor™️ series.
Over the past two months, we’ve examined data on local-commerce foot traffic patterns — specifically in light of shifting behavior due to quarantining and other measures around the containment of Covid-19. In a related effort, NinthDecimal has put its location intelligence platform to work.
This creates a sort of public service announcement by volunteering the capabilities of its core technology that tracks large-scale opted-in mobile devices. This is normally done for O2O attribution and marketing insights, but here provides timely and telling insights on pandemic-related shifts in local commerce.
This includes two reports the company shared with Localogy, which we examined here. Now it’s updated and upgraded its data reporting in its Economic Mobility Index (EMI). The best way to view it is the interactive charts that it’s made available on its Covid-19 Resource Center (and highlights below).
The goal of EMI is to track economic recovery across U.S. cities to gaining insight on local business questions like where and when to ramp up operations and marketing spend. This includes key indicators like economic activity by business category, company, city (DMA) and overall levels.
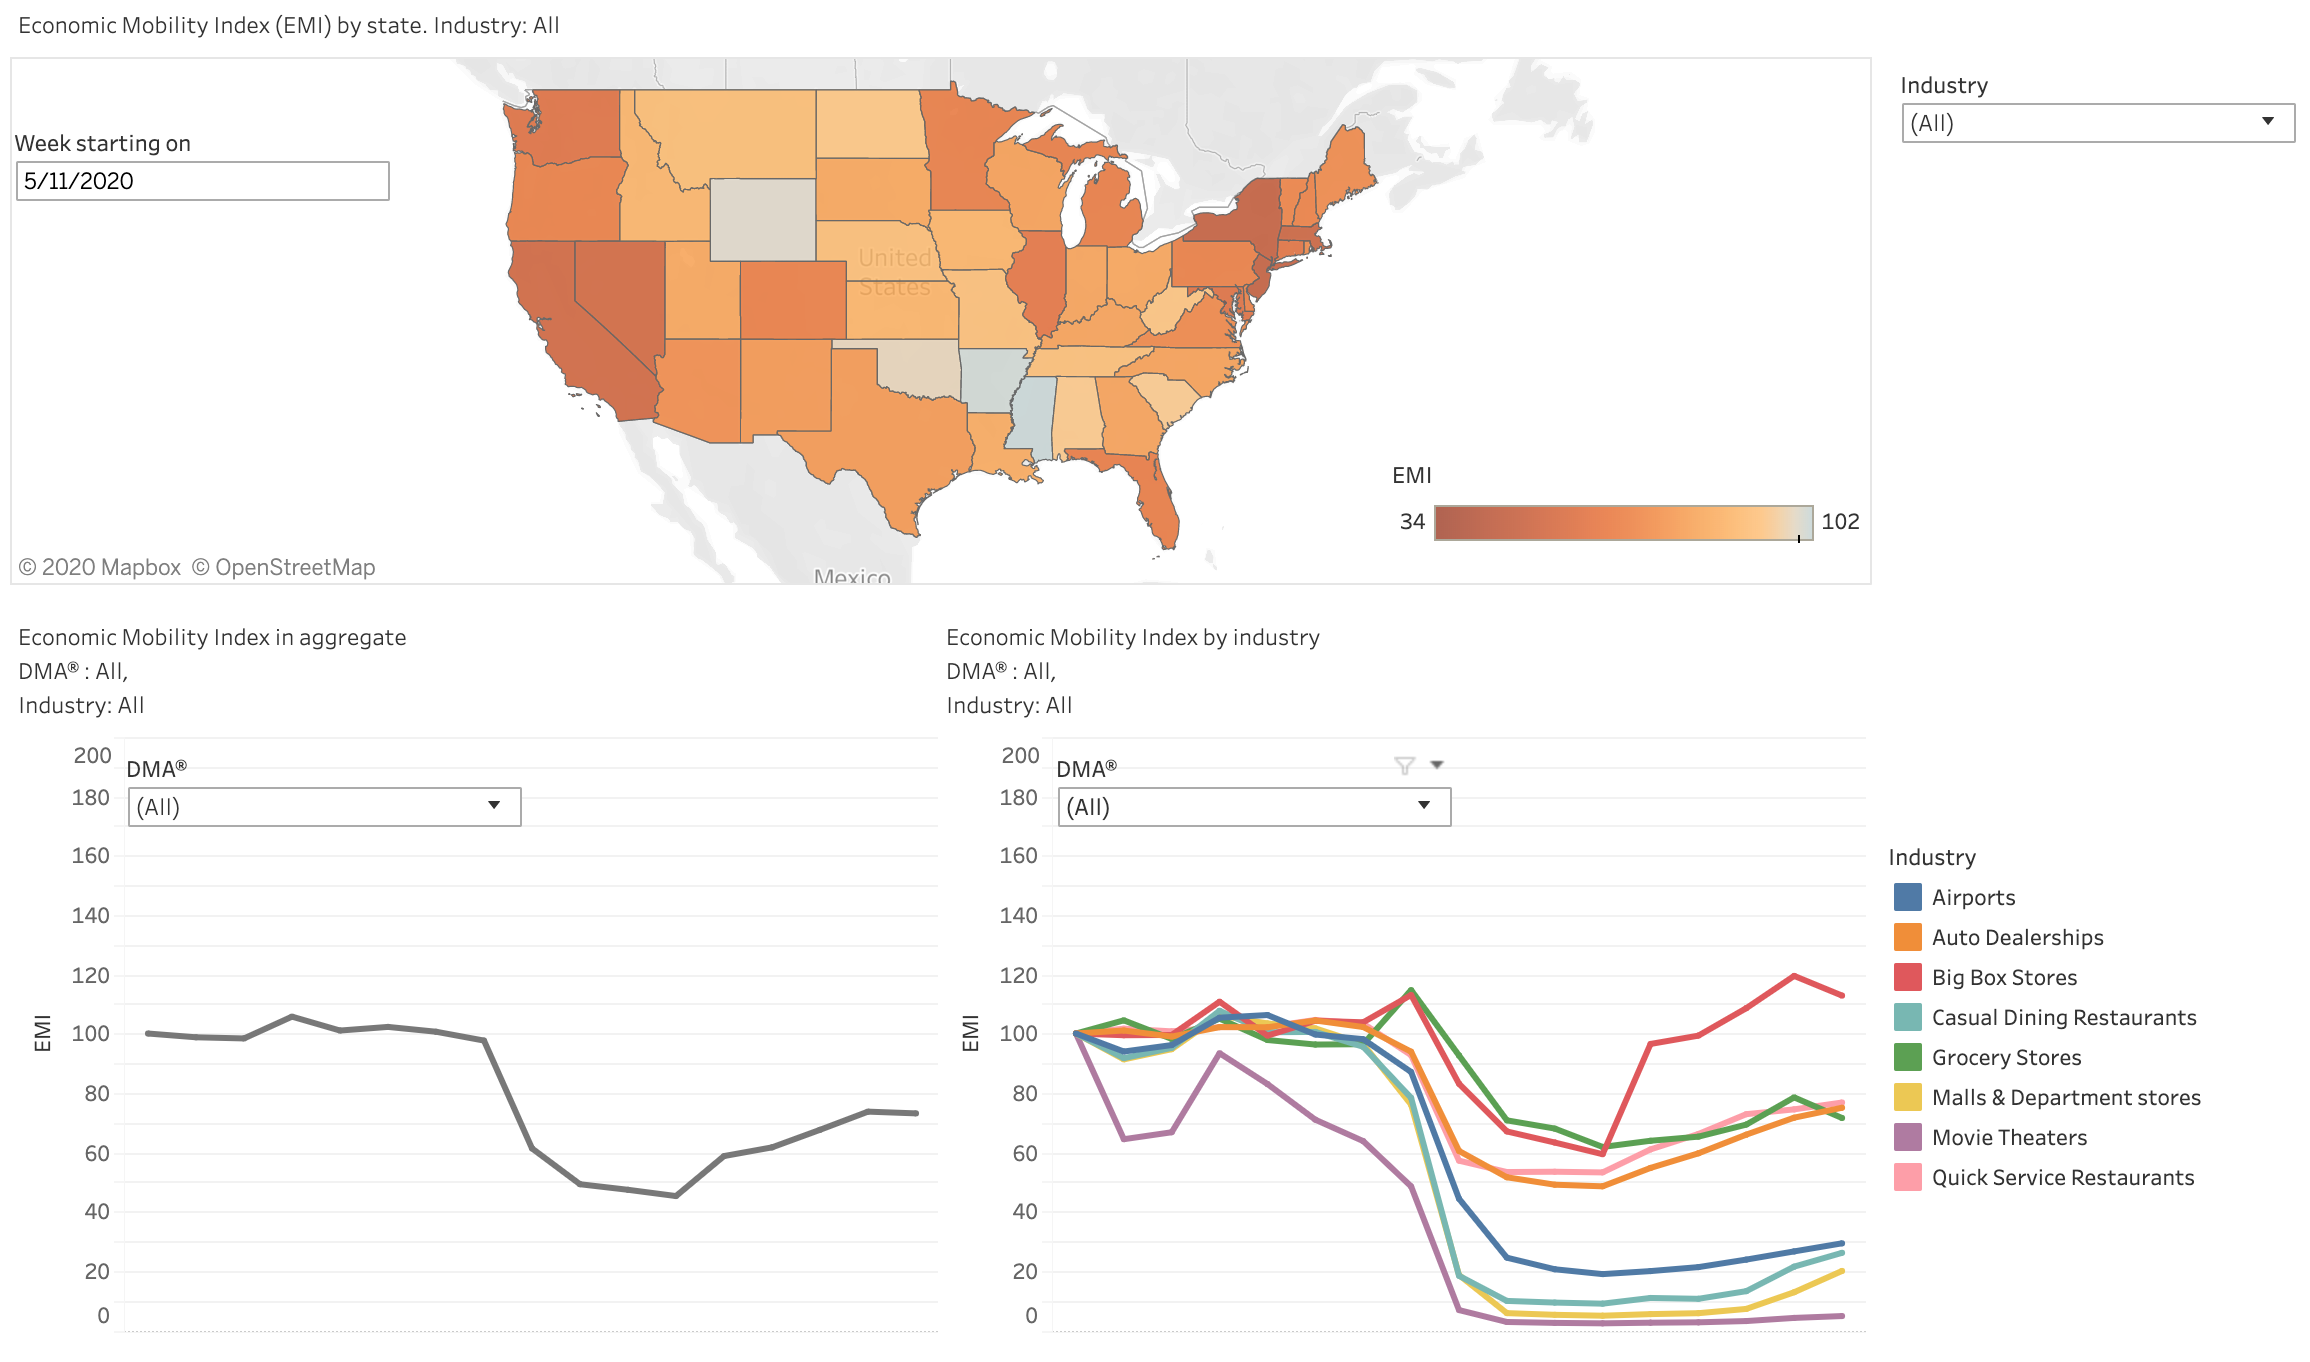
So what did the data uncover? For the week starting 5/11, index scores are as follows, using pre-pandemic levels (week of January 20) as a baseline score of 100
— The overall mobility index across all business categories and DMAs stands is 72 (representing commerce-mobility of 72 percent of baseline activity)
— New York and Massachusetts remain the most commerce-immobile states (indicative of statewide closures and distancing measures), followed by California and Nevada.
— Montana, South Carolina, West Virginia and Louisiana have the highest commerce-related mobility.
— Across all DMAs, big box stores remain the most commerce-mobile, followed by grocery stores and auto dealerships (curiously).
— Conversely, movie theaters, malls & department stores and casual dining are the most commerce-immobile
These results aren’t surprising and in line with news coverage, but index scores across these variables provide quantifiable degrees of activity. The point, as mentioned above and in our past data examinations, is to inform key decisions. That can be everything from SMB operations to public policy.
NinthDecimal’s methodology was to apply its mobile location tracking technology to consumer activities that indicate economic activity. For example, measuring foot traffic patterns in commercial districts versus behavior that would indicate recreational activity or exercise. See more methodology notes here.
Note: The chart below is a graphic, and more interactive functionality is provided here.