

Covid Location Index is Localogy’s series that examines Covid-era consumer behavior, as tracked by location intelligence providers. Each article drills down on a different data release from companies using their location platforms to track localized foot traffic, and inform re-opening strategies. See the full series here.
Over the past two months, we’ve examined a steady stream of data releases on local commerce foot traffic. This is obviously relevant in light of shifting behavior due to social distancing and lockdown measures. More importantly, these data releases have shifted over the past month to inform SMB re-opening strategies.
After several and ongoing data sets from Foursquare, NinthDecimal, Unacast and others, the latest we’ve collected is from Reveal Mobile. Similar to the above players, it has put its location-tracking technology to use in revealing (excuse the pun) shifting patterns in local consumer behavior compared to a pre-Covid baseline.
Specifically, Reveal Mobile collects privacy-compliant location data from mobile devices and matches it with its point-of-interest database of 12 million businesses. This is normally done to inform marketing strategies, target messaging or attribute campaign effectiveness, but in this case is put to a more altruistic purpose.
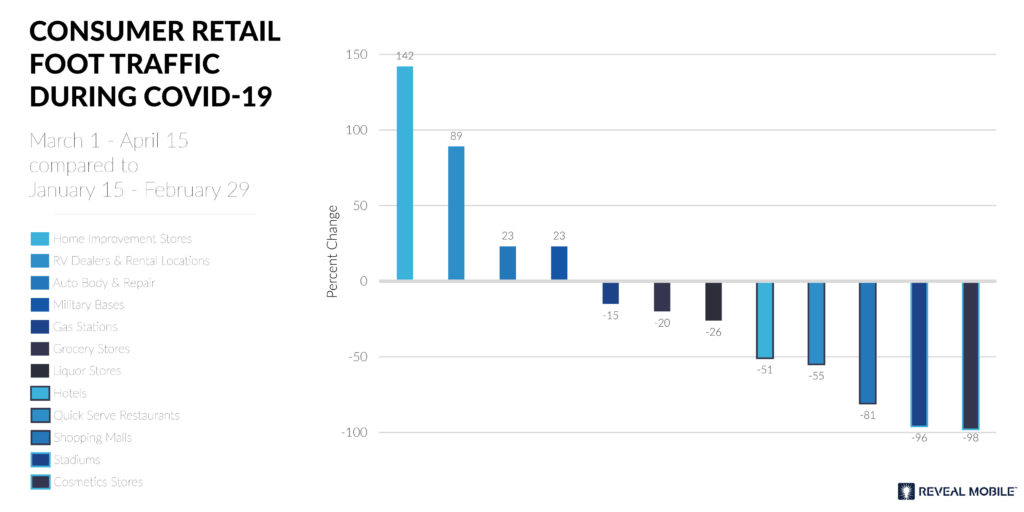
So what did it find out? By comparing the 45 days ending 4/15 to a pre-Covid baseline of January 15-February 29th, it uncovered some expected and some unexpected results. Here are a few highlights.
— The biggest foot traffic gainer was home improvement and hardware stores, up 142 percent over the baseline.
— RV dealerships and rentals saw the second-largest lift at 89 percent.
–This first-unexpected result makes sense when considering that RVs offer an alternative to travel bans for those who must go long distances.
— RV’s also reduce the risk-prone need for on-the-road human interaction like hotel stays.
— It’s also a “bucket-list” activity for some people who now have more time and mental need to escape.
— Auto-repair and auto body shops saw a 23 percent increase over the baseline period.
— This is likewise surprising at first but could be explained by the extra time (and idle vehicles) individuals now have to take care of auto maintenance needs that have been put off.
— It’s also one of the few ways to support local businesses, as auto-shops are designated essential.
— Foot traffic to military bases has meanwhile increased 23 percent over the baseline period.
— This is a non-consumer category not covered by other studies we’ve examined, but is noteworthy.
— It could be explained by international travelers and cruise ship travelers quarantining at military bases for 14 days.
— As for categories that experienced a drop in foot traffic, these are mostly as expected:
— Airports, stadiums, movie theaters, convention centers and shopping malls lead the list.
— One notable example is cosmetics stores, which experienced a 98 percent drop in foot traffic versus the baseline period.
— However, it’s encouraging that this hasn’t caused a reduction in sales, as many cosmetics brands and industry associations report sales growth in the same period.
— This is telling data for shifting distribution channels for high-demand products, and the fact that that demand transcends external factors in some categories.
— It also has strategic implications for local brick & mortar companies in this vertical: a call to arms for e-commerce functionality, such as Shopify support.
More details are in the chart below and here.
These are mostly expected outcomes in terms of category-specific foot-traffic patterns. But the degree of activity is notable. The underlying point is to view this data as an indicator of what we can expect as various states reopen, and therefore hopefully a valuable tool to inform SMB operational decisions.
We’ll continue tracking Covid-era local consumer behavior, as these data sets continue to roll out from location intelligence providers. Meanwhile, the full archive of coverage can be seen here.


