Over the past month, we’ve spotlighted data on local-commerce foot traffic patterns — specifically in light of shifting behavior due to quarantining and other measures around the spread of Covid-19. After examining GroundTruth, Foursquare and Ninth Decimal data, Unacast joins the mix.
Its Social Distancing Scoreboard is sort of a public service announcement that volunteers the capabilities of its technology that tracks opted-in mobile devices. This is normally done for marketing insights, but here it provides timely and telling insights on pandemic-related shifts in consumer movement.
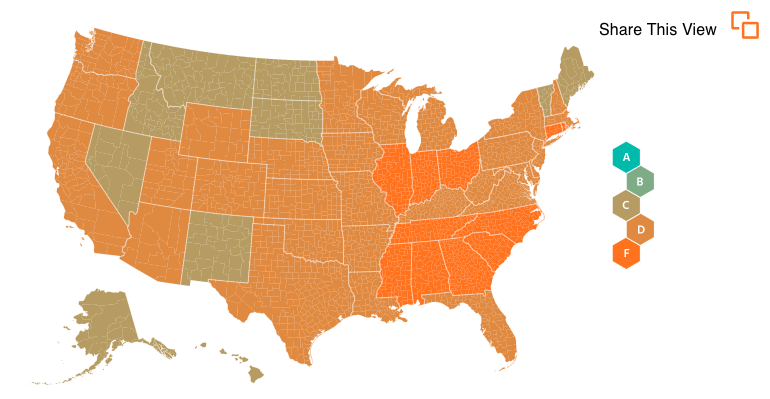
Like the above players, Unacast’s report looks at local foot traffic patterns. But rather than breaking them down by business category, it segments by state. It applies a letter grade to states and other geographic boundaries, based on how its movement data indicate individuals are social distancing.
Also unique about this data set is its delivery. The data reside on a constantly-updated landing page. This makes it dynamic and up to date for the purposes of insights and decision making.
So what did the data uncover? It evaluates geographies on three measures:
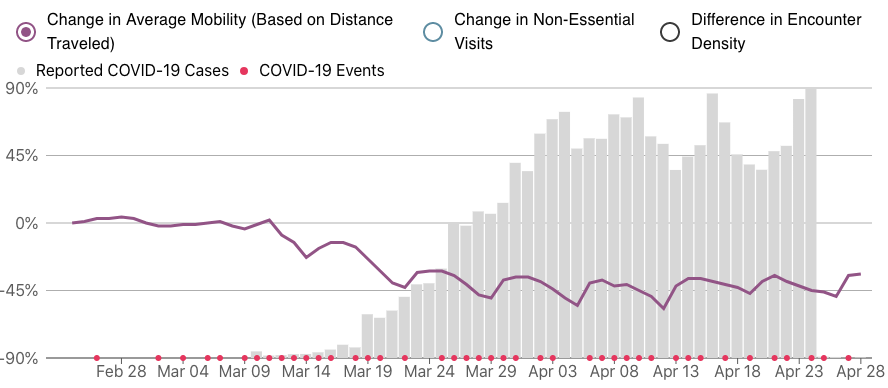
— Change in Average Mobility
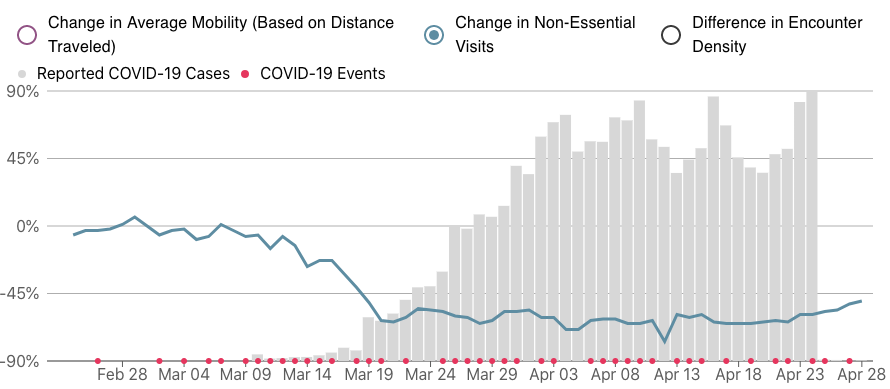
— Change in Non-Essential Visits
— Difference in Encounter Density
On those measures, it found the following:
— The U.S. as a whole gets a D-, as of the time of this writing
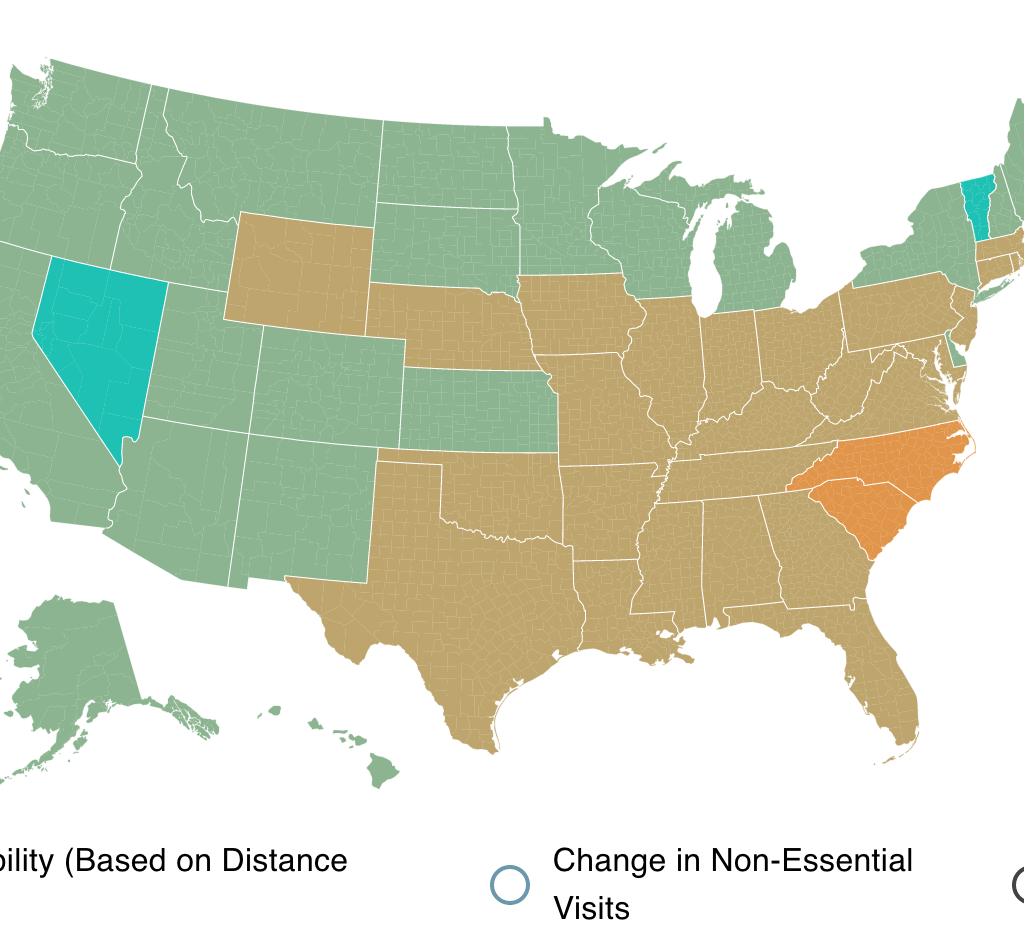
— The state with the highest score is Nevada, but it only gets a C+, as of the time of this writing
— The states with the worst score include an 8-way tie with F-letter grades, including Ohio and Rhode Island.
More can be seen in the charts below. But note that these are screenshots of the most updated data at the time of this post’s publication. For updated data on an ongoing basis, click the charts to go to the live/dynamic landing page.
U.S. State-by-State Letter Grades for Social Distancing.
Change in Average Mobility
Change in Non-Essential Visits
Difference in Encounter Density

Stay tuned for more data releases from location-intelligence players that continue to examine the pandemic’s real impact on local commerce.