
Quick, what’s the most popular social media network or app? TikTok? Instagram? What about streaming platforms? Netflix? HBO Max? I’m sure we all have our own anecdotal evidence to make a solid guess, but Variety Intelligence has taken out the guesswork in its latest report, the Demographic Divide.
Though we’ve framed this as “social channels” above, Variety rather refers to these channels as entertainment apps, which is also technically accurate (and is Variety’s jam). These lines are blurring as the likes of TikTok and Instagram Stories are branching into long-form video, as well as snackable fare.
Either way, the game is the same: competing for a fixed pie of consumers’ time. This has been an ongoing battle, though the pie has become more fragmented with challengers like Snapchat, TikTok, and Instagram. The simpler times when we had radio and three television networks are long gone.
Fragmented Mix
On to the data, what did Variety Intelligence find out? Starting with overall consumption, the 30-44 age group is the most active when it comes to the total quantity of media sources at 22.8. That’s followed by 15-29 year-olds (21.1), 45-59 year-olds (17.3), and 60+ (12.9). These results align with expectations.

Social & Streaming
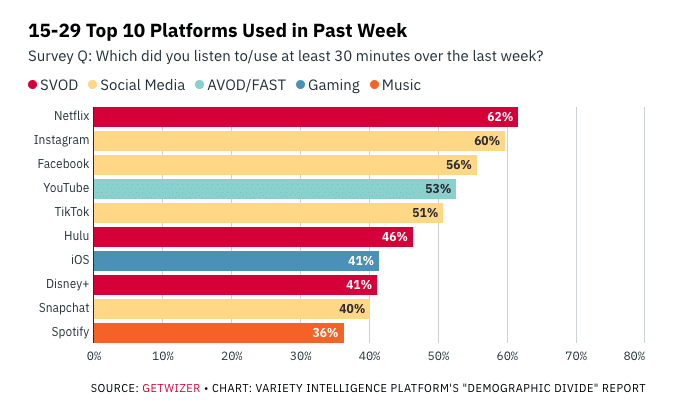
But where things get more interesting is when drilling down to the specific media sources that these age groups use. They vary widely across demographics, with the biggest differences coming from the 15-29 block (lots of social media and streaming entertainment, and 45-59 groups (lots of network TV).
Starting with the former, Netflix is the biggest place they spend their time with 62 percent of users engaging for 30+ minutes per week. That’s followed by Instagram (60 percent), Facebook (56 percent), YouTube (53 percent), TikTok (51 percent), and Hulu (46 percent). See the rest of the results below.
A Certain Age
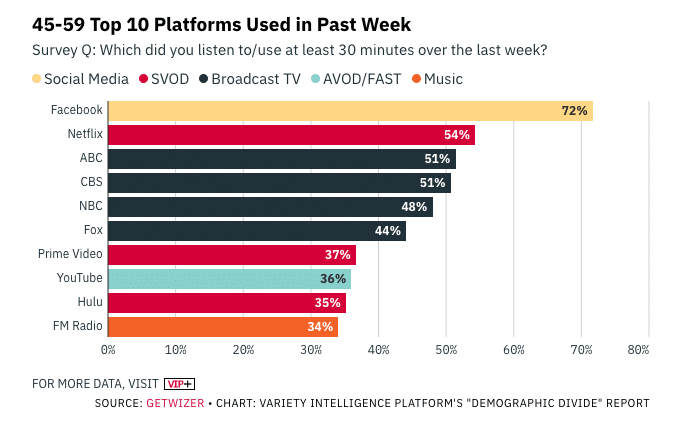
As for the 45-59 age range, their distribution of time is a much different story. There, Facebook is dominant with 72 percent of respondents reporting that they engage 30+ minutes per week. Keep in mind this metric isn’t overall users but those who engage at a certain volume on a weekly basis.
In second place is Netflix at 54 percent, which is one common thread with the 15-29 year-olds examined above. But commonalities stop there, as the list continues with ABC (54 percent) CBS (51 percent), NBC (48 percent) Fox (44 percent), Prime video (37 percent), YouTube (36 percent) and Hulu (35 percent).
Not Your Grandfather’s Media Mix
If you’re thinking of your grandparents when you’re reading these results, you’re probably not alone. In fact, one surprising media source made this list: FM radio. It’s consumed at least 30 minutes per week by 34 percent of 45-59-year-olds. That’s not dominant but it’s just one point below Hulu (sorry Hulu…)
So what’s the takeaway? Media consumption continues to be a moving target. And it continues to fragment, meaning the job of brand marketers and media buyers is getting more complicated. The name of the game will continue to be segmenting audiences and choosing channels accordingly.
We’ll keep our crosshairs on that moving target as we roll into 2023…