Covid Location Index is Localogy’s series that examines Covid-era consumer behavior, as tracked by location intelligence providers. Each article drills down on a different data release from companies using their platforms to track localized foot traffic, and inform re-opening strategies. See the full series here.
Over the past three months, we’ve examined a steady stream of data releases on local commerce foot traffic. This is obviously relevant in light of shifting behavior due to social distancing and lockdown measures. More importantly, these data releases have shifted over the past month to inform SMB re-opening strategies.
After several and ongoing data sets from Foursquare, NinthDecimal, Unacast, Reveal Mobile and others, the latest we’ve collected is from GroundTruth. Similar to the above players, it has put its location-tracking technology to use to shine a light on shifting consumer foot-traffic patterns versus pre-Covid baselines.
If this sounds familiar, you may remember GroundTruth launched a similar effort that was an early installment of our Covid Location Index coverage. At the time, it sought to track and draw insights from consumer behavioral shifts in the pandemic’s initial weeks (think: big box stores and gas stations).
Now the focus has changed, just as the world’s behavior and informational needs have. Like many of the players mentioned above, it’s now all about informing business decisions for reopening strategies. Consumer behavior across business categories in early-open states can be proxy for expected behavior others.
So what did it find out? By comparing the timeframe between February 1 and June 1, its Daily Foot Traffic Tracker offers a wide baseline of pre-pandemic activity, and the subsequent drop-off until the present. Here are a few highlights.
— The big plummet happened around March 13, and has sustained to the present, with some uptick seen during May and early June.
— Foot traffic continues to spike consistently on Saturdays, presumably as shelter-in-place masses emerge to accomplish personal errands and gather weekly supplies
— QSR and grocery see the highest index of foot traffic while bars and retail see the lowest. These are expected results, but some open-air environments like parks and beaches unexpectedly see greater dips.
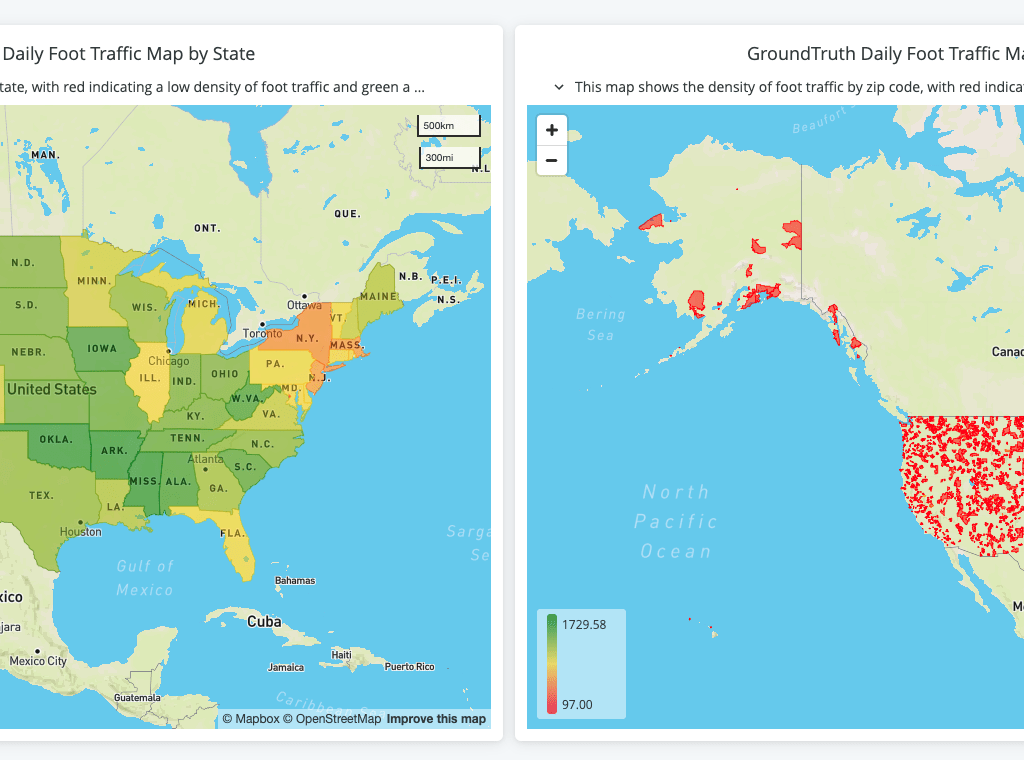
— Nationally speaking (see graphic below), there hasn’t been a large uptick in activity throughout May, which defies expectation, due to official reopening allowances.
— However, state by state filtering (see interactive chart) reveals key insights about business categories prone to swing back faster than others. The greatest activity can be seen in Georga and Texas, thus proxies for potential behavior in other states.
More details are in the chart below and here. Note that some of the images below are static but click to be taken to the full interactive charts.


These are mostly expected outcomes in terms of category-specific foot-traffic patterns. But the degree of activity is notable. The underlying point is to view this data as an indicator of what we can expect as various states reopen, and therefore hopefully a valuable tool to inform SMB operational decisions.
For GroundTruth and others, they’re applying their core tech towards an applicable and timely end. In other words, they’re normally used to inform marketing strategies, target messaging or attribute campaign effectiveness, but in this case is put to a more altruistic (and partly opportunistic visibility-gaining) purpose.
We’ll continue tracking Covid-era local consumer behavior, as these data sets continue to roll out from location intelligence providers. Meanwhile, the full archive of coverage can be seen here.