Over the past two months, we’ve examined Foursquare’s ongoing data on local-commerce foot traffic patterns — specifically in light of shifting behavior due to social distancing and lockdown measures. We also promised we’d stay on top of that moving target as new data become available.
True to that promise, we’re back with the fifth batch of data. The background is that Foursquare’s core technology tracks large-scale opted-in mobile devices for location-marketing insights. In this context, the data track “new normal” foot-traffic patterns versus baseline (pre-Covid) activity.
Batches 1 & 2 covered the beginnings of regional shelter-in-place orders, while the third batch took us into the thick of the lockdown period. The fourth provided signals that indicated what we can expect as many states reopen while relaxing stay at home orders and business closures.
Building on that, the Fifth and latest release deviates from the first four in spinning off the singularly-branded Recovery Index. Similar to Ninth Decimal’s recent data release, the point here is to examine consumer movement data to help inform business decisions around reopening strategies.
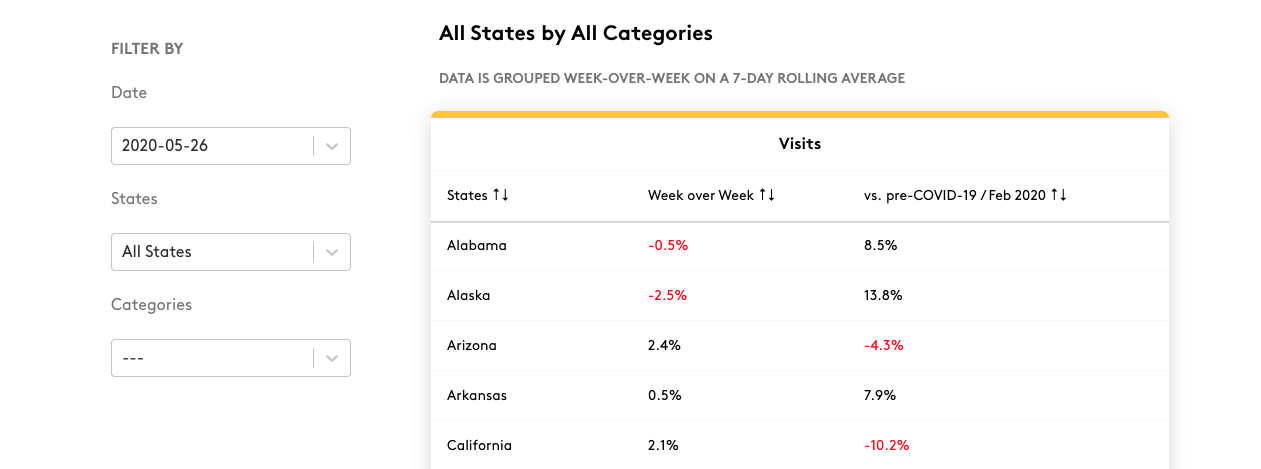
Foursquare’s Recovery Index does this by tracking changes in visitation week-over-week and relative to pre-pandemic baseline activity in February (more methodology details here). This all takes place in an interactive chart that you can see and play with. Variables include states, dates and business categories.
After playing with it and manipulating various inputs, it appears to be a powerful utility in gaining on-the-ground data for consumer movement patterns across these variables. The best way to experience that is on the interactive chart itself, but here are a few quick takeaways from our time with the data.
— Georgia, one of the first states to reopen non-essential businesses, experienced a 10.5 percent boost in visits to hair salons and barbershops from April 24 – May 13.
— Other states can expect similar ranges of increased activity as they reopen, especially in business categories that have comparable levels of pent-up demand (things that require upkeep or maintenance).
— San Francisco county (where I live) has seen an 8.5% week-over-week increase in restaurant visits, but it’s still down 43.5 percent from pre-covid levels.
— This steady rise in restaurants and similar categories can be used to extrapolate how long it will take to return to pre-Covid levels, if growth rates sustain.
Note: The chart below is a static image, and more interactive functionality is provided here.
These are mostly expected outcomes in terms of re-assimilation and consumer confidence levels. But the degree of activity is notable. The underlying point is to view this data as an indicator of what we can expect as various states reopen, and therefore hopefully a valuable tool to inform SMB operational decisions.
“The Foursquare Recovery Index is a resource that showcases the role location data plays as brands work to recapture consumers’ attention as they rebuild their muscle memory around offline consumption in a post-pandemic world,” said Foursquare CEO David Shim. “Post-COVID-19, location data will be essential as brands and business owners in every category seek to understand foot traffic patterns and evolve their strategies to meet the needs of their customers in a changed world.”